How to Show Margin in Chrome Inspect
Aug 3, 2024
Inspecting elements in a web browser is a crucial skill for web developers, designers, and anyone interested in understanding how web pages are structured. Google Chrome's Developer Tools (DevTools) offer a powerful way to inspect elements, modify styles, and debug layouts. In this blog post, we will focus on how to show and manipulate margins using the Chrome Inspect tool. We will also cover essential coding terms, provide code snippets, and optimize the content for search engines.
Understanding Inspect Element
Inspect Element is a feature in modern web browsers that allows users to view and edit the source code of a webpage. This includes HTML, CSS, and JavaScript. The ability to inspect elements is invaluable for developers and designers as it enables them to see how changes in the code affect the layout and styling of a webpage in real-time.
How to Open Inspect Element
To begin using the Inspect Element feature in Chrome, you can follow one of the methods below:
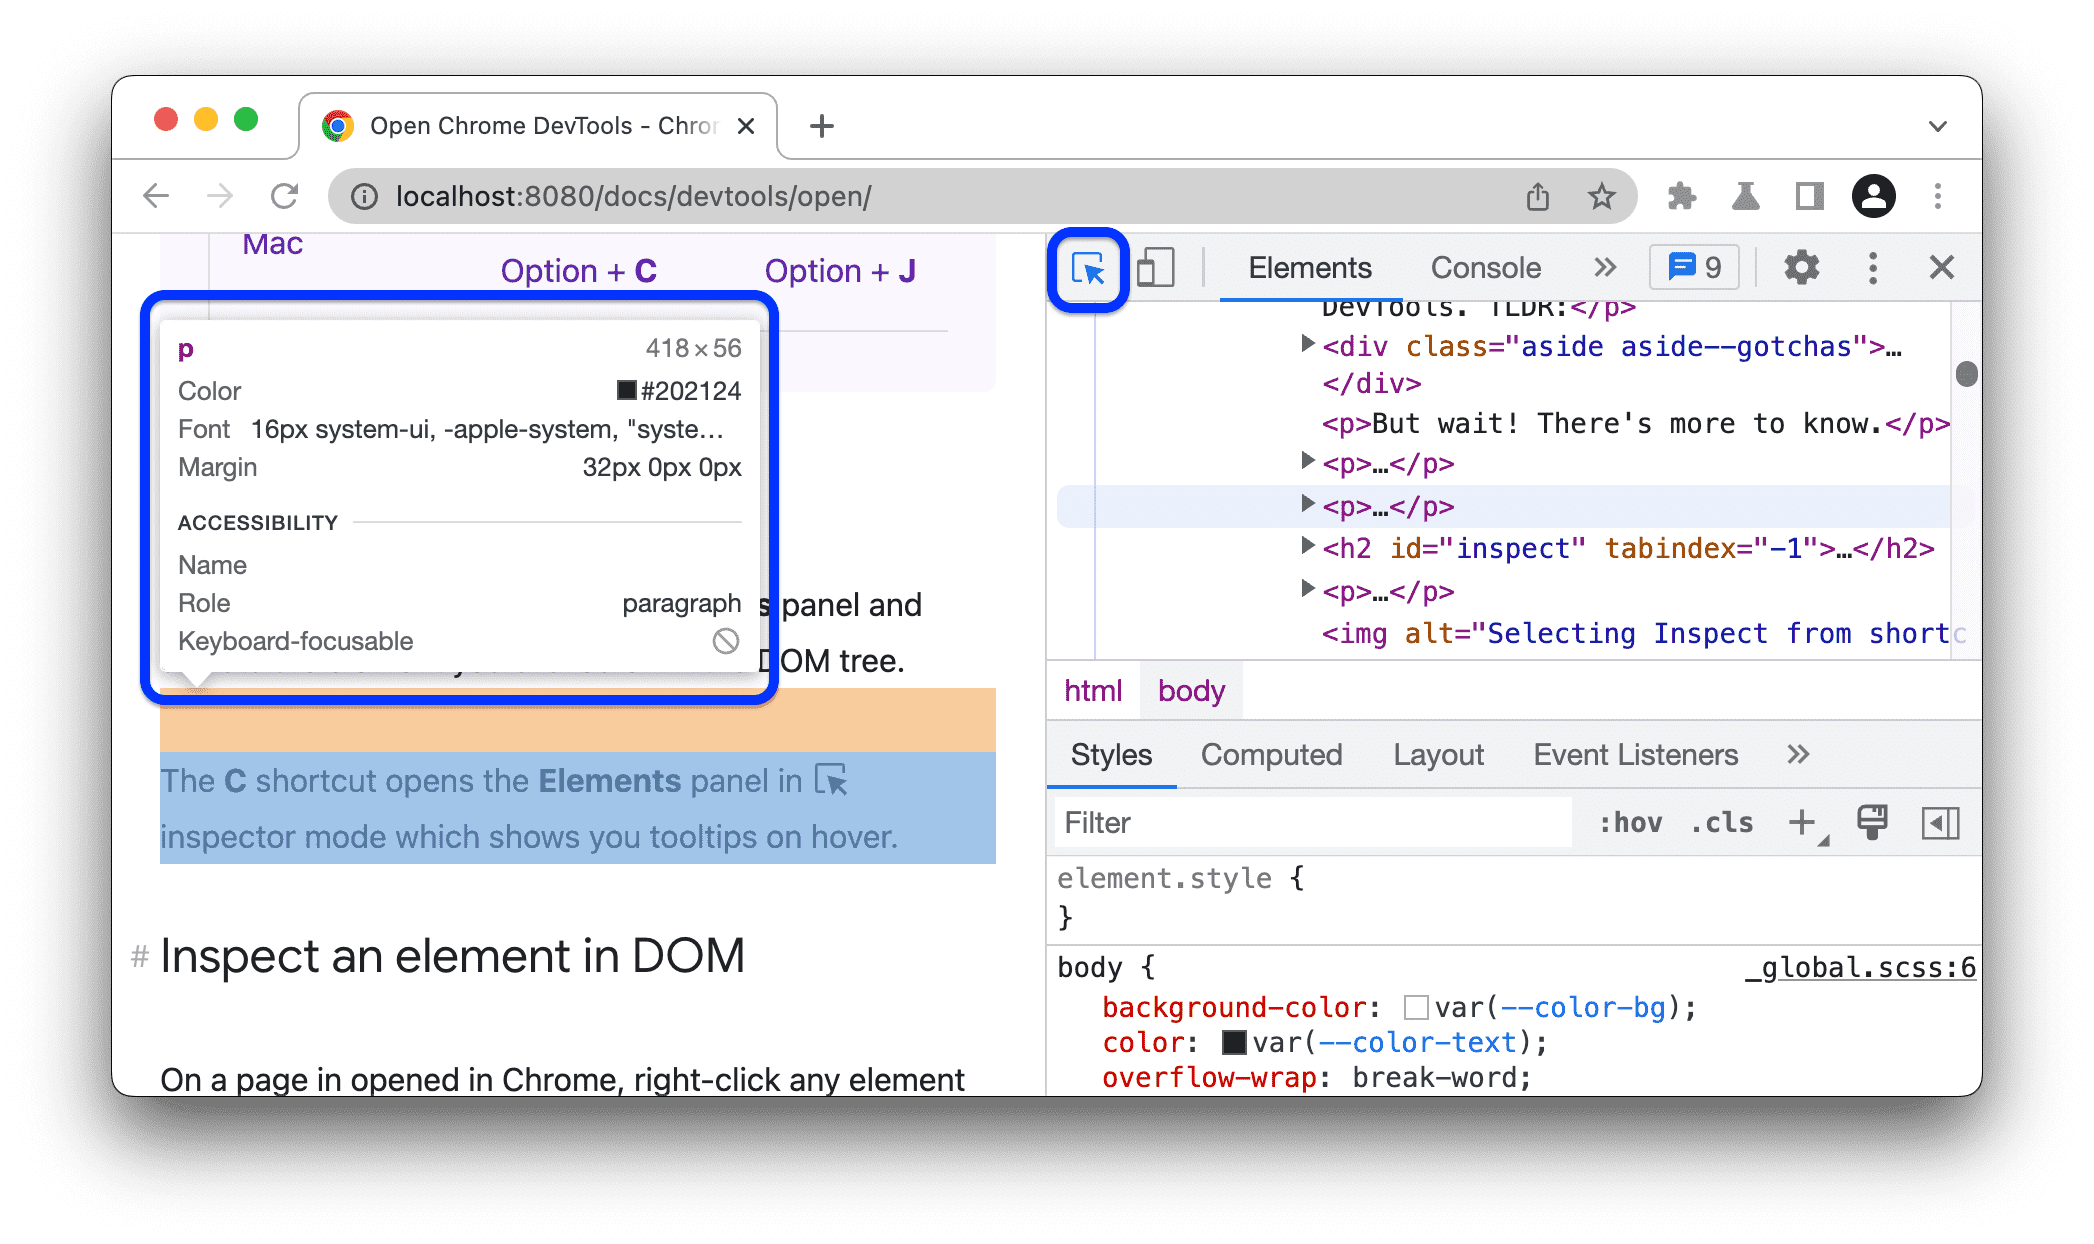
Right-click Method: Right-click on any part of the webpage and select Inspect from the context menu. This will open the DevTools panel, highlighting the element you clicked on.
Keyboard Shortcuts: You can use the following shortcuts to open the Inspect Element tool:
For Windows:
Ctrl + Shift + IFor Mac:
Command + Option + I
Menu Navigation: Alternatively, you can navigate through the menu by selecting View > Developer > Developer Tools from the top menu bar.
Exploring the Chrome Layout Debugger
Once you have opened the DevTools panel, you will see several tabs, including Elements, Console, Sources, and more. The Elements tab is where you will spend most of your time when inspect the elements.
The Elements Panel
The Elements panel displays the Document Object Model (DOM) tree, which represents the structure of the webpage. Here, you can see the HTML elements and their associated styles. To show margins specifically, you can:
Select an Element: Click on an element in the DOM tree or directly on the webpage to highlight it.
View the Box Model: In the Styles pane, look for the Box Model section. This section visually represents the element's margin, border, padding, and content area.
How to Show and Change Margins
To effectively show and manipulate margins using the Chrome Inspect tool, follow these steps:
Inspect the Element: Right-click on the element you want to inspect and select Inspect. The element will be highlighted in the DOM tree.
Locate the Box Model: In the Styles pane, find the Box Model diagram. This diagram will show you the current margin values for the selected element.
Edit the Margin:
Directly in the Box Model: Hover over the margin area and double-click on the value to edit it. You can enter a new value (e.g.,
20px,1em, etc.) and pressEnterto apply the change.Using CSS Styles: In the Styles pane, you can add or modify the
marginproperty directly in the CSS rules. For example:
Inspecting Margins with the Chrome Layout Debugger
The Chrome Layout Debugger is a feature that helps visualize how elements are laid out on a page. To use it:
Open the DevTools: Use the methods mentioned earlier to open the DevTools.
Toggle Device Toolbar: Click the Toggle Device Toolbar icon (or use
Ctrl + Shift + Mfor Windows orCommand + Shift + Mfor Mac) to switch to responsive design mode.Inspect the Layout: Select an element and view its layout properties in the Styles pane. The layout debugger will show you how margins, paddings, and other properties affect the element's position.
Common Coding Terms Related to Inspecting Margins
Margin: The space outside an element's border, separating it from other elements.
Padding: The space between an element's content and its border.
Box Model: A box that wraps around every HTML element, consisting of margins, borders, padding, and the actual content.
CSS (Cascading Style Sheets): A stylesheet language used to describe the presentation of a document written in HTML or XML.
Code Snippet Example
Here’s a simple HTML and CSS example to illustrate how margins work:
In this example, the .container class centers the content, while the .box class applies a margin of 20px around the box.
Conclusion
Learning how to show and manipulate margins using the Chrome Inspect tool is an essential skill for anyone involved in web development. By understanding how to use the Inspect Element feature, you can make real-time changes to your web pages, debug layout issues, and enhance your design workflow.In summary, the steps to show margins in Chrome Inspect include:
Opening the DevTools using right-click, keyboard shortcuts, or menu navigation.
Selecting the element you want to inspect.
Viewing and editing margins in the Box Model section of the Styles pane.
Utilizing the Chrome Layout Debugger for a visual representation of the layout.
By mastering these techniques, you will be well-equipped to create visually appealing and well-structured web pages.
Happy inspecting!