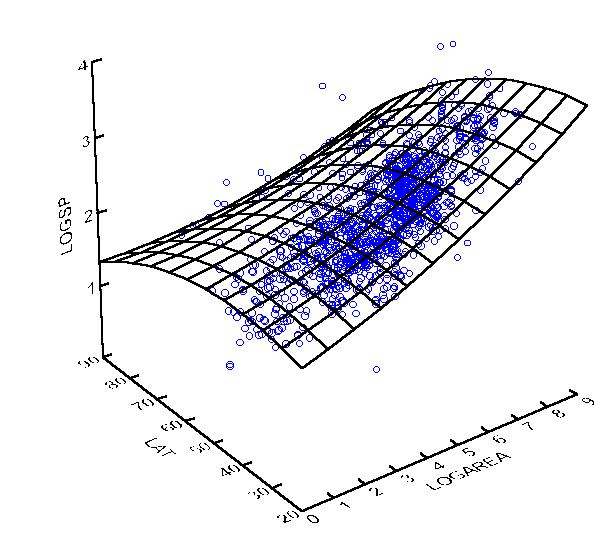
Introduction to Multivariate Regression
Aug 17, 2024

Multivariate regression is a powerful statistical technique used to model the relationship between a dependent variable and multiple independent variables. It extends the concept of simple linear regression by allowing for the inclusion of more than one predictor variable in the model. This technique is widely used in various fields, such as finance, economics, marketing, and social sciences, to analyze complex relationships and make predictions.
In this comprehensive blog post, we will dive deep into the world of multivariate regression, exploring its underlying concepts, assumptions, and practical applications. We will also provide coding examples using Python to illustrate the implementation of multivariate regression models.
Understanding Multivariate Regression
Multivariate regression aims to find the best linear relationship between a dependent variable (also known as the response variable) and a set of independent variables (also known as predictor variables or features). The general form of a multivariate regression model can be expressed as : y=β0+β1x1+β2x2+...+βpxp+ϵ
where:
$y$ is the dependent variable
$x_1, x_2, ..., x_p$ are the independent variables
$\beta_0$ is the intercept term
$\beta_1, \beta_2, ..., \beta_p$ are the regression coefficients for each independent variable
$\epsilon$ is the error term, representing the unexplained variation in the dependent variable
The goal of multivariate regression is to estimate the values of the regression coefficients ($\beta_0, \beta_1, ..., \beta_p$) that minimize the sum of squared residuals between the observed values of the dependent variable and the predicted values based on the model.
Assumptions of Multivariate Regression
To ensure the validity and reliability of the multivariate regression model, several assumptions must be met:
Linearity: The relationship between the dependent variable and independent variables should be linear.
Multicollinearity: The independent variables should not be highly correlated with each other.
Homoscedasticity: The variance of the error term should be constant across all levels of the independent variables.
Independence: The error terms should be independent of each other.
Normality: The error terms should follow a normal distribution.
Violating these assumptions can lead to biased or inefficient estimates of the regression coefficients and unreliable inferences.
Implementing Multivariate Regression in Python
Let's dive into a practical example of implementing multivariate regression using Python. We'll use the scikit-learn library, which provides a convenient way to fit and evaluate regression models.
In this example, we first split the dataset into training and test sets using train_test_split. We then create an instance of the LinearRegression model and fit it to the training data using the fit method. The intercept_ and coef_ attributes provide the estimated intercept and coefficients of the fitted model, respectively.To make predictions on new data, we use the predict method and pass the test set features X_test. Finally, we evaluate the model's performance by calculating the R-squared score and Mean Squared Error (MSE) using the score method and custom calculations.
Interpreting the Results
After fitting the multivariate regression model, we can interpret the results to gain insights into the relationships between the dependent variable and independent variables:
Intercept: The intercept term ($\beta_0$) represents the expected value of the dependent variable when all independent variables are zero.
Coefficients: Each regression coefficient ($\beta_1, \beta_2, ..., \beta_p$) represents the change in the dependent variable associated with a one-unit increase in the corresponding independent variable, holding all other variables constant.
Statistical significance: We can assess the statistical significance of each coefficient using t-tests or p-values. A low p-value (typically less than 0.05) suggests that the coefficient is significantly different from zero, indicating a strong relationship between the independent variable and the dependent variable.
Model fit: Measures such as R-squared and adjusted R-squared provide an indication of how well the model fits the data. R-squared ranges from 0 to 1, with higher values indicating better model fit.
Applications of Multivariate Regression
Multivariate regression has a wide range of applications in various domains:
Predicting sales: Multivariate regression can be used to predict sales based on factors such as advertising spending, competitor prices, and economic indicators.
Estimating housing prices: Real estate prices can be modeled as a function of location, size, number of bedrooms, age of the property, and other relevant factors.
Analyzing customer satisfaction: Customer satisfaction can be related to factors such as product quality, customer service, and pricing.
Forecasting stock returns: Stock returns can be predicted based on macroeconomic variables, industry factors, and company-specific characteristics.
Assessing the impact of policies: The effects of government policies or interventions can be evaluated by regressing the outcome variable on the policy variable and other relevant factors.
Limitations and Extensions
While multivariate regression is a powerful technique, it has some limitations:
Linearity assumption: If the relationship between the dependent variable and independent variables is non-linear, the model may not fit the data well.
Multicollinearity: High correlation among independent variables can lead to unstable and unreliable estimates of the regression coefficients.
Omitted variable bias: If important variables are omitted from the model, the estimated coefficients may be biased.
To address these limitations, researchers may consider:
Transforming variables: Applying logarithmic, square root, or other transformations to variables can help linearize the relationships.
Regularization techniques: Methods like ridge regression and lasso regression can help mitigate the effects of multicollinearity and perform variable selection.
Including interaction terms: Incorporating interaction terms between independent variables can capture non-linear relationships and synergistic effects.
Using panel data: Analyzing data with both cross-sectional and time-series dimensions can help control for unobserved heterogeneity and omitted variables.
Conclusion
Multivariate regression is a versatile and widely used statistical technique for modeling complex relationships and making predictions. By incorporating multiple independent variables, multivariate regression provides a more comprehensive understanding of the factors influencing the dependent variable.
In this blog post, we have covered the key concepts, assumptions, and applications of multivariate regression. We have also provided a coding example using Python to illustrate the implementation of multivariate regression models.