Introduction to Time Series Models
Aug 13, 2024
Time series models are a powerful tool for analyzing and predicting data that varies over time. These models are widely used in various fields, including finance, economics, and meteorology, to understand patterns, trends, and make forecasts based on historical data.
In this comprehensive blog post, we will explore the fundamentals of time series models, their types, and applications. We will also delve into the importance of time series models in data science and provide practical examples using Python code snippets.
Understanding Time Series Data
Time series data is a sequence of observations recorded at regular intervals over time. These observations typically depend on previous ones and may exhibit trends, seasonality, and randomness. Understanding the characteristics of time series data is crucial for successful modeling and forecasting.
Time series data can be categorized into two main types:
Univariate time series: Involves a single variable observed over time, such as stock prices or temperature measurements.
Multivariate time series: Involves multiple variables observed simultaneously, often used in complex applications like climate modeling or economic forecasting.
Types of Time Series Models
There are various types of time series models, each with its own strengths and applications. Let's explore some of the most commonly used models:
Statistical Models
Auto-Regressive (AR) Models: These models assume that the current value of a time series is determined by a linear combination of its past values. The simplest form is the AR(1) model, which considers only the immediate past value, while more complex variations like AR(p) models take into account multiple past values.Moving Average (MA) Models: These models assume that the current value depends on a linear combination of past random error terms. The basic MA(1) model considers only the previous error term, while MA(q) models consider q past error terms.
Auto-Regressive Integrated Moving Average (ARIMA) Models: ARIMA models combine both Auto-Regressive and Moving Average components and incorporate differencing to make the time series stationary. ARIMA models are widely used in time series analysis and forecasting.
Machine Learning Models
Linear and Nonlinear Regression Models: These models can be used for time series forecasting, with predictors including time and historical values.
Decision Tree-Based Models: These models can capture nonlinear relationships and are suitable for both univariate and multivariate time series data.
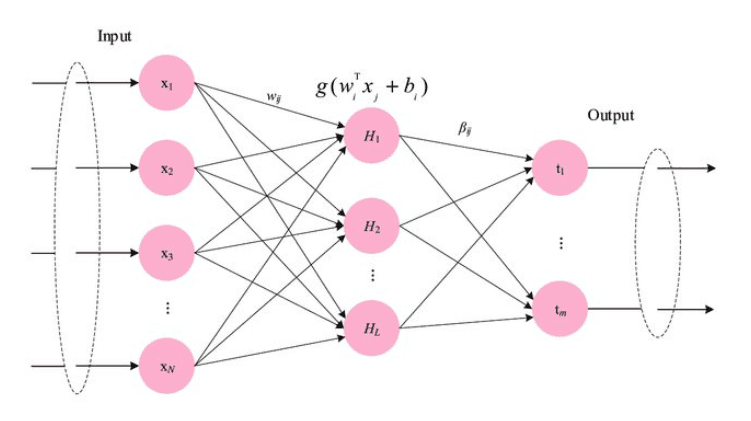
Recurrent Neural Networks (RNNs): RNNs, particularly Long Short-Term Memory (LSTM) networks, have shown great promise in capturing complex patterns in time series data. LSTMs are designed to overcome the limitations of traditional RNNs, such as the vanishing gradient problem.
Hybrid Models
Prophet: Prophet is a hybrid forecasting method developed by Facebook that efficiently handles seasonality and holiday effects.
XGBoost: XGBoost is an ensemble learning method that combines the strength of gradient boosting with decision trees to improve forecasting accuracy.
Data Preprocessing for Time Series Modeling
Before applying time series models, data preprocessing is essential to ensure the data is suitable for analysis. Some common preprocessing steps include:
Handling missing data: Imputation techniques are used to fill in missing values.
Dealing with outliers: Identifying and handling outliers is crucial for robust predictions.
Creating relevant features: Features like lag variables or seasonal indicators can enhance the performance of time series models.
Model Evaluation and Selection
Evaluating and selecting a suitable time series model is a critical step in the process. Some common evaluation metrics include:
Mean Absolute Error (MAE): Measures the average absolute difference between predicted and actual values.
Root Mean Squared Error (RMSE): Measures the average squared difference between predicted and actual values, giving more weight to larger errors.
Mean Absolute Percentage Error (MAPE): Measures the percentage deviation between predicted and actual values, providing a way to gauge the accuracy of a forecasting model.
The choice of a time series model depends on factors like the dataset's characteristics, the desired balance between accuracy and interpretability, and the specific requirements of the problem at hand.
Applications of Time Series Models
Time series models find applications in various fields, enabling better decision-making and forecasting. Some common applications include:
Finance: Time series forecasting is widely used in predicting stock prices, currency exchange rates, and interest rates, aiding investment decisions.
Business: Businesses employ time series forecasting to optimize inventory management, improve supply chain efficiency, and ensure product availability.
Environmental Science: Time series models help predict climate patterns, air quality, and natural disasters, contributing to environmental research and policy.
Healthcare: Forecasting models assist in predicting disease outbreaks, hospital admissions, and resource allocation in the healthcare sector.
Electricity Load Forecasting: Time series models are used to predict electricity demand, enabling efficient resource allocation and grid management.
Practical Example: Forecasting Gold Prices using ARIMA
Let's dive into a practical example of using an ARIMA model to forecast gold prices. We'll use Python and the statsmodels library for this example.
In this example, we load a dataset containing gold prices from 1950 to 2020, split the data into training and testing sets, fit an ARIMA model to the training data, and make predictions on the test set. We then evaluate the model's performance using the Mean Absolute Percentage Error (MAPE) metric and visualize the actual and predicted gold prices.
Conclusion
Time series models are essential tools for understanding and predicting data that varies over time. By exploring the types of time series models, their applications, and practical examples, we can gain valuable insights into the world of time series analysis.
As data science and machine learning continue to evolve, the importance of time series models will only grow. Advancements in deep learning techniques, the ability to handle large volumes of data, and efforts to make forecasting models more interpretable and transparent will further enhance the capabilities of time series models.